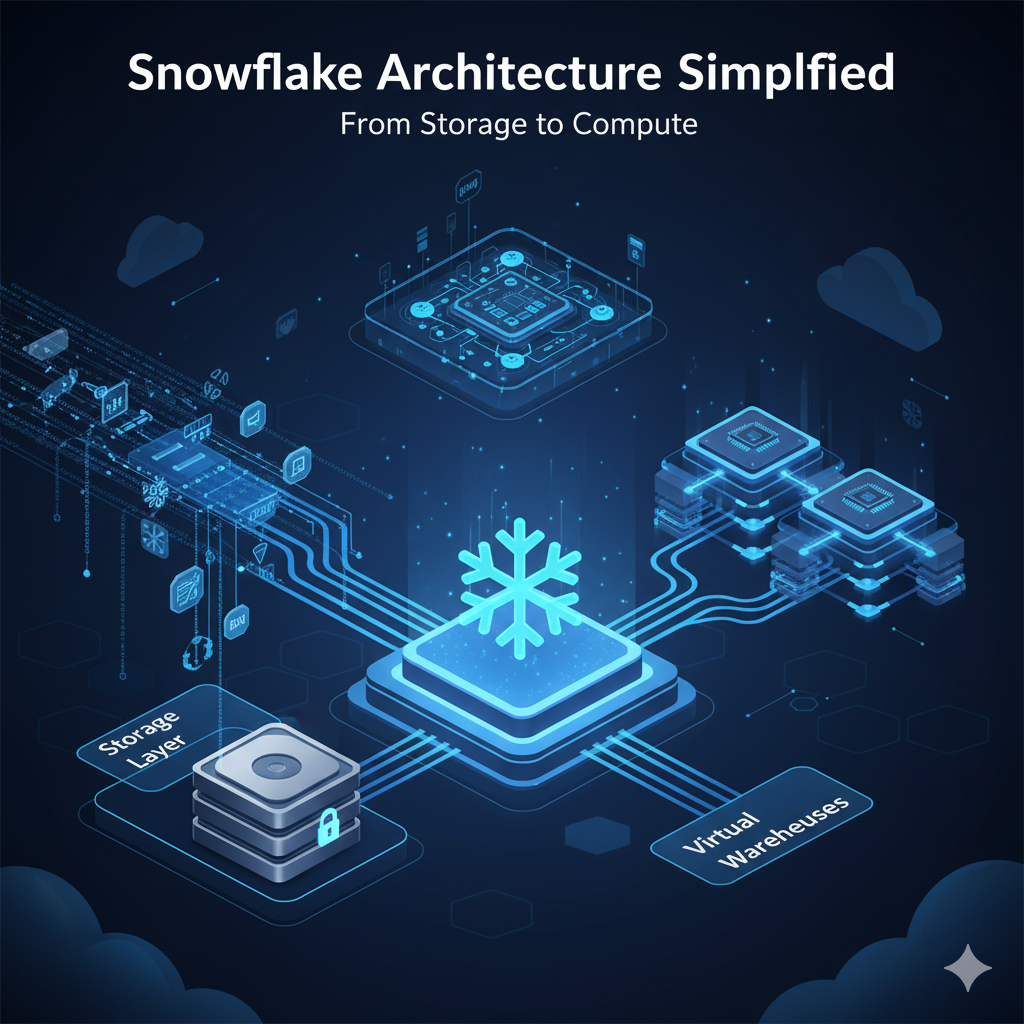
In today’s data-driven world, businesses generate massive volumes of data every second. Traditional data warehouses often struggle to keep up with the scalability, speed, and flexibility modern analytics demand. Enter Snowflake, a revolutionary cloud data warehouse built to overcome these limitations.
What sets Snowflake architecture apart is its unique design that separates storage, compute, and services — allowing organizations to analyze data faster, scale resources seamlessly, and pay only for what they use.
In this guide, we’ll simplify Snowflake’s architecture, walking you step-by-step through its three key layers: Storage, Compute, and Services. By the end, you’ll understand how Snowflake works under the hood and why it’s a preferred choice for businesses worldwide.
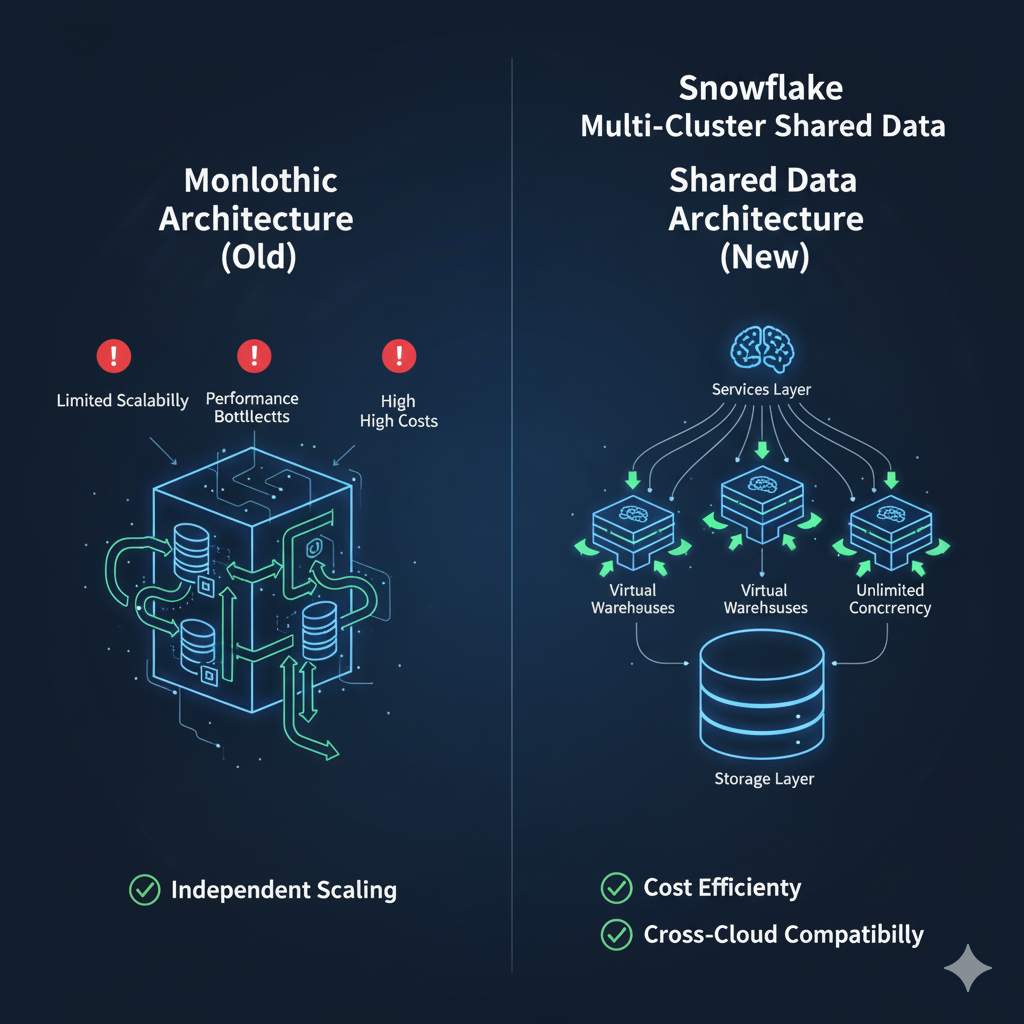
Before Snowflake, most data warehouses followed a monolithic architecture where storage and compute were tightly coupled. This created multiple challenges:
Snowflake solved these problems by introducing a multi-cluster, shared data architecture designed for the cloud.
Think of Snowflake as a high-speed train where the tracks (storage), engines (compute), and control center (services) operate independently but in perfect harmony.
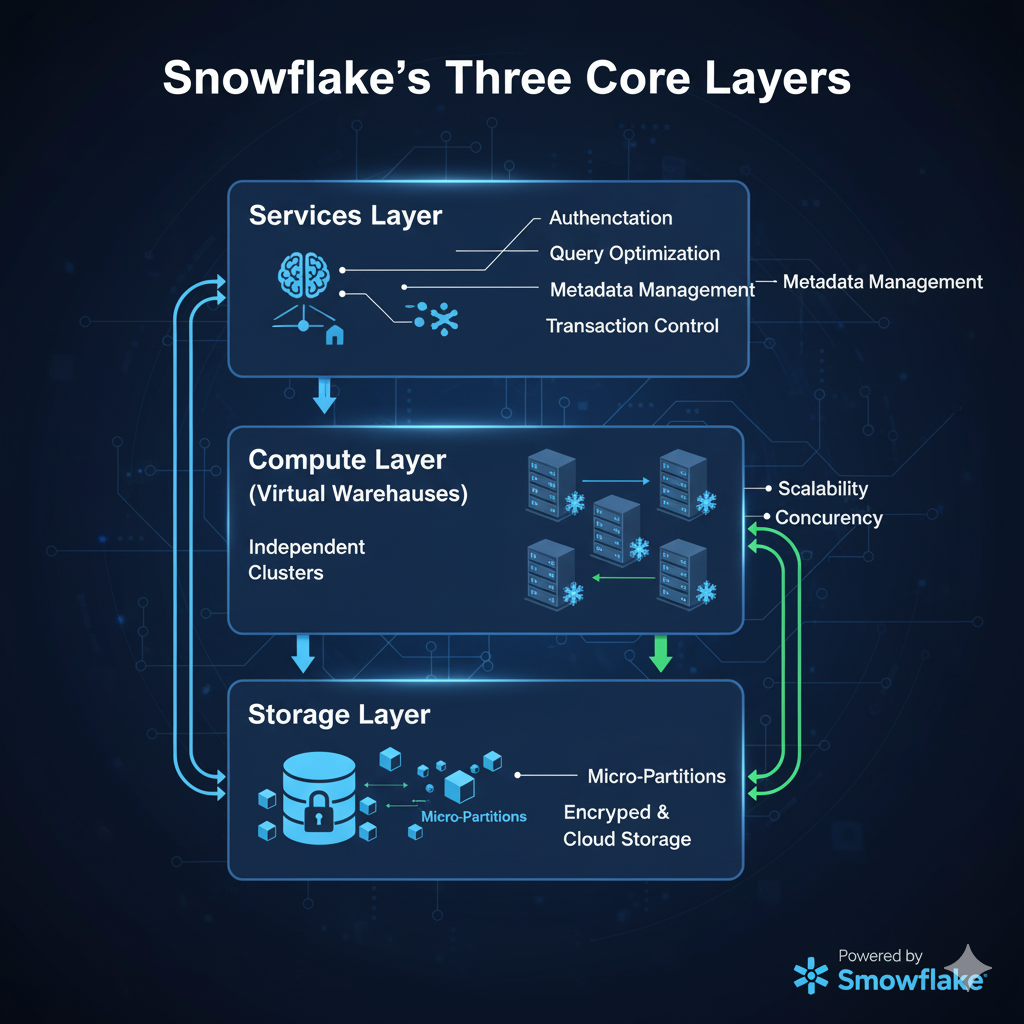
Snowflake is built on three core layers, each serving a specialized purpose but designed to work together efficiently.
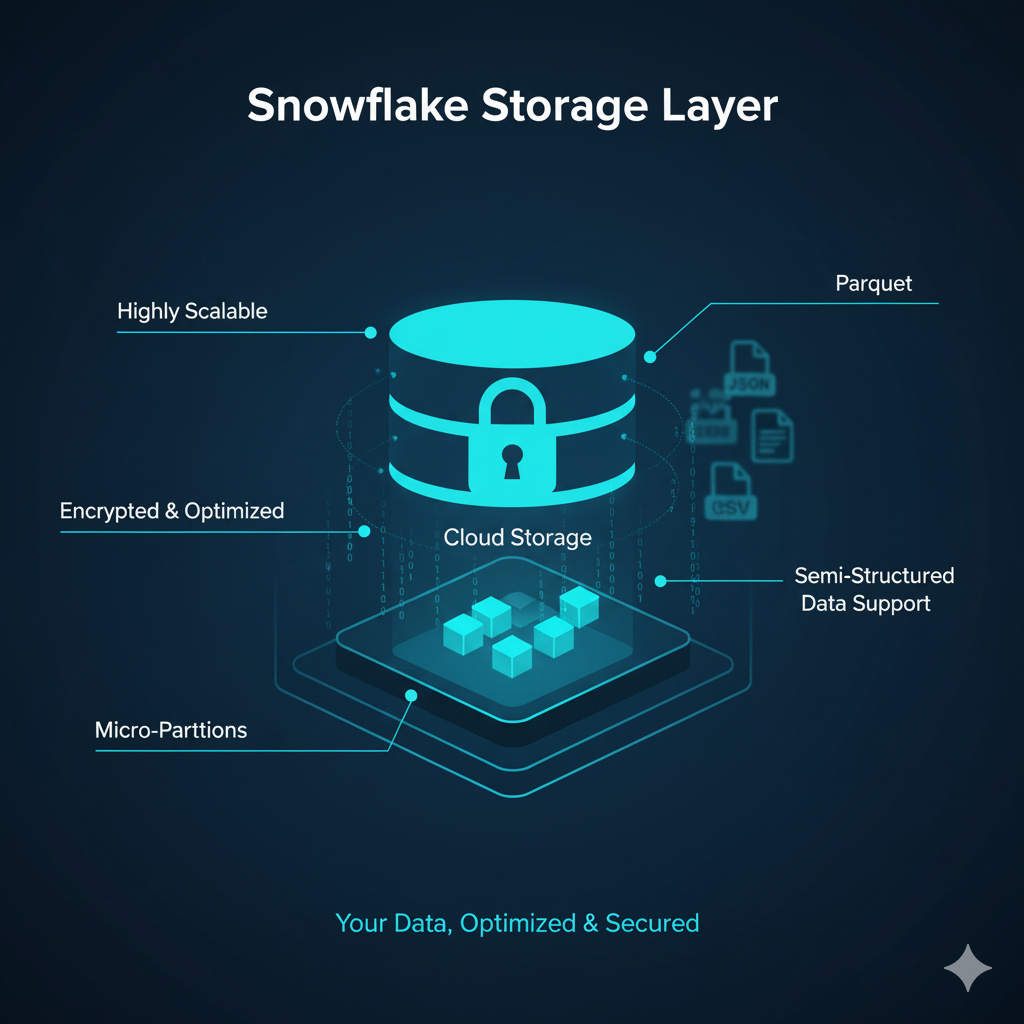
The storage layer is where all your structured and semi-structured data (like JSON, Parquet, and Avro) lives.
Snowflake automatically organizes data into compressed micro-partitions, making it faster to access and cheaper to store.
How it works:
Benefits of the storage layer:
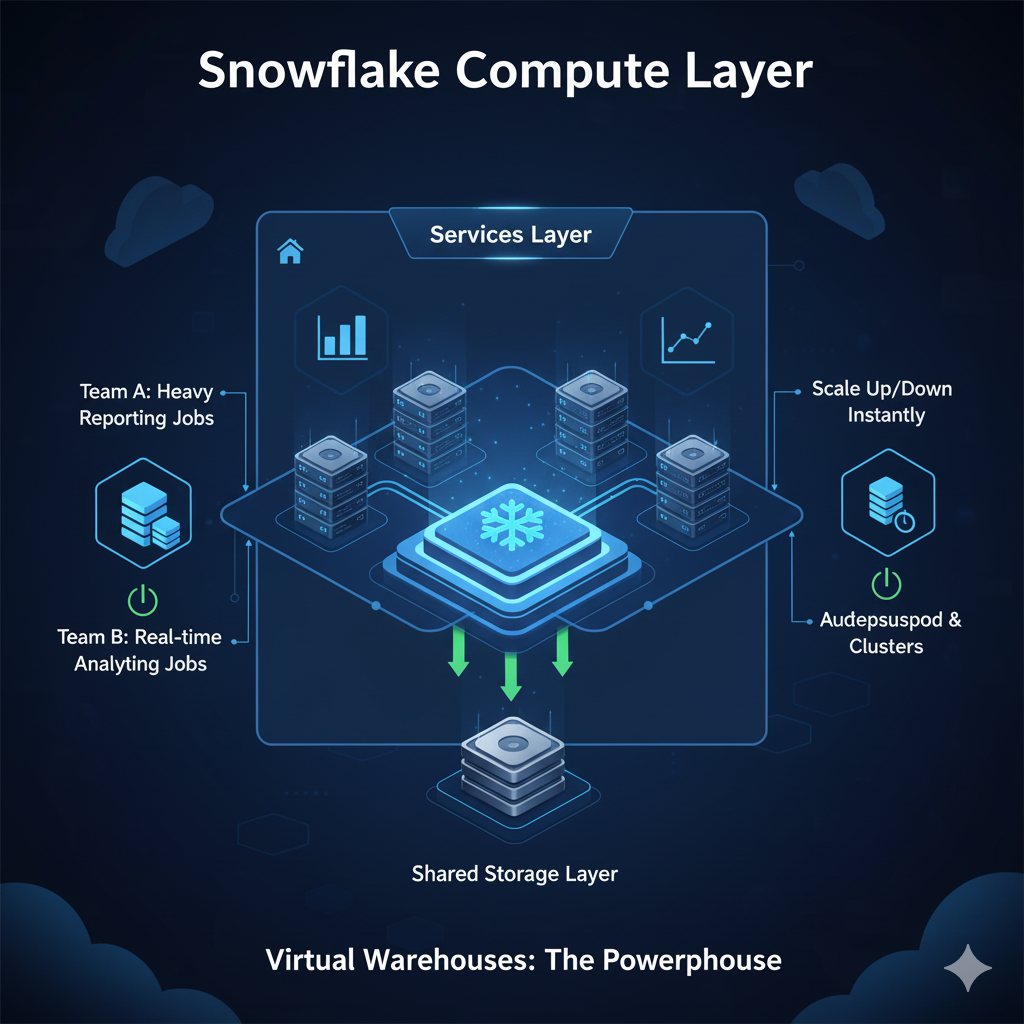
The compute layer is powered by Virtual Warehouses, which are independent clusters of compute resources used for running queries and processing data.
Key features of Virtual Warehouses:
Example Use Case:
Imagine a retail company:
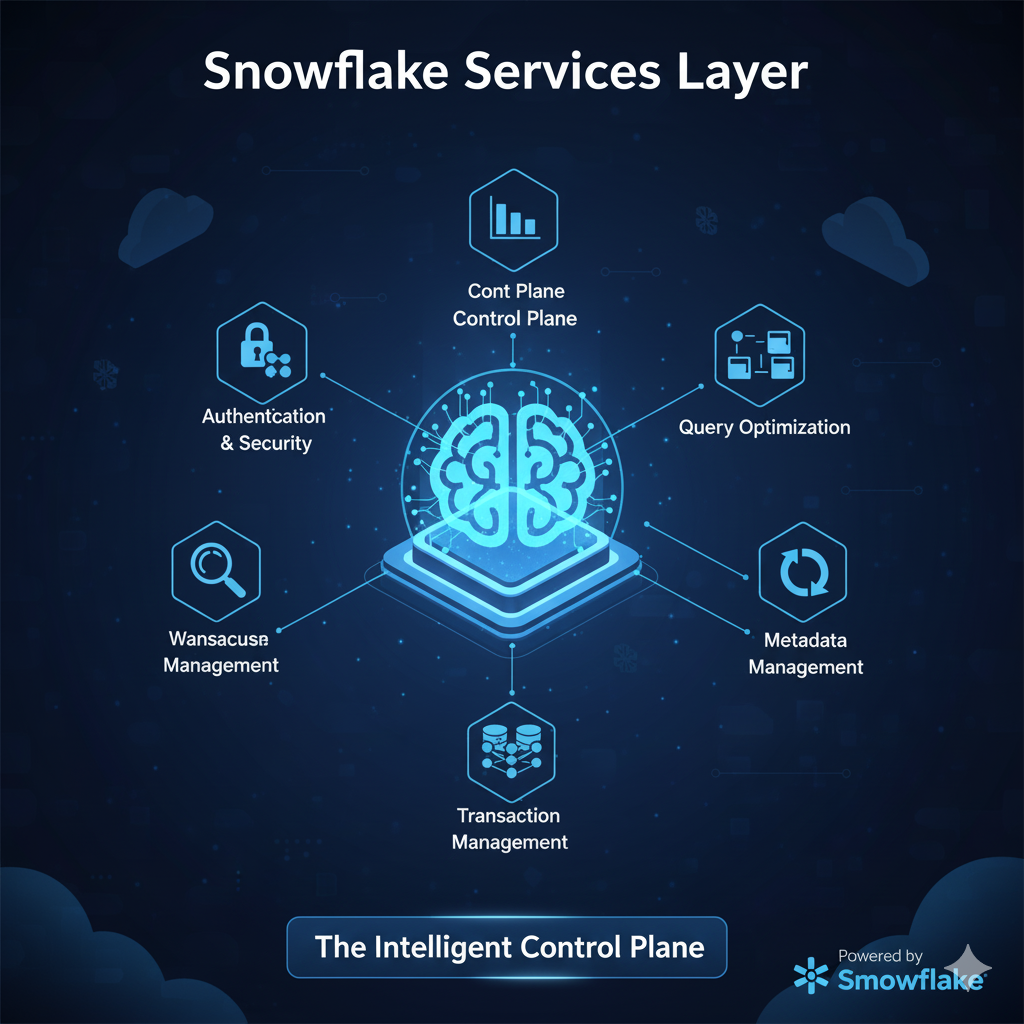
The services layer is like Snowflake’s brain, coordinating and optimizing everything happening across storage and compute.
Core responsibilities include:
Think of the services layer as an air traffic controller — ensuring smooth and safe operations between all the moving parts.
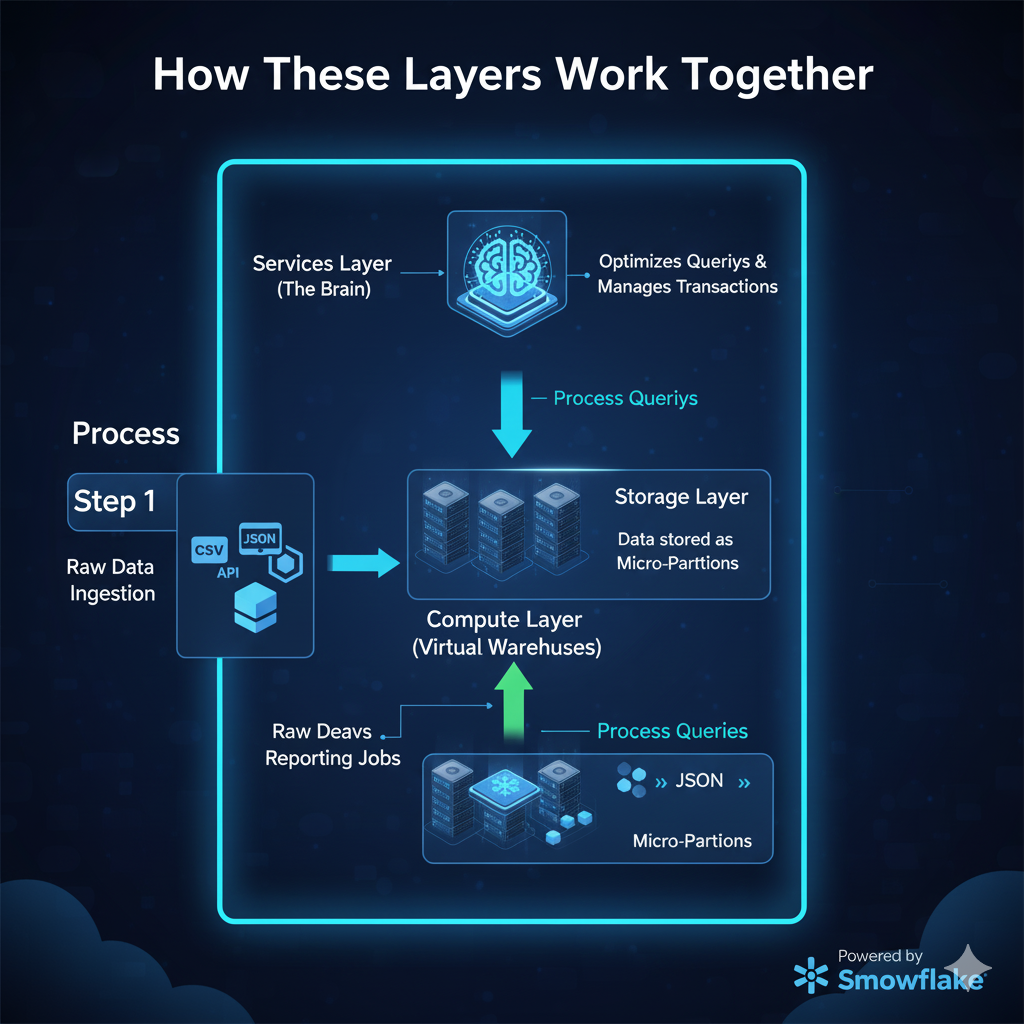
Here’s a step-by-step example of how data flows through Snowflake’s architecture:
| Step | Process | Snowflake Layer |
|---|---|---|
| 1 | Raw data is ingested from external sources (e.g., CSV, JSON, APIs). | Storage |
| 2 | Data is securely stored in micro-partitions. | Storage |
| 3 | A Virtual Warehouse spins up to process queries. | Compute |
| 4 | Services layer optimizes queries and manages transactions. | Services |
| 5 | Users get real-time analytics results. | Output |
This clear separation of responsibilities enables Snowflake to deliver unmatched speed, scalability, and reliability.
A global retail chain uses Snowflake to handle billions of daily transactions.
Result:
| Advantage | How Snowflake Delivers It |
|---|---|
| Scalability | Independently scale compute and storage as needed. |
| Performance | Query optimization and result caching. |
| Concurrency | Multiple teams query data simultaneously without conflicts. |
| Cost Optimization | Pay only for resources used, with auto-suspend features. |
| Cross-Cloud Flexibility | Works seamlessly on AWS, Azure, and GCP. |
Snowflake’s innovative architecture — with its separation of storage, compute, and services — has redefined what’s possible in modern data warehousing. By embracing this cloud-native model, businesses can achieve unlimited scalability, high performance, and cost efficiency like never before.
Whether you’re just starting your Snowflake journey or looking to optimize your existing setup, understanding the architecture is your first step toward data-driven success.
1. How does Snowflake separate storage and compute?
Snowflake uses independent layers for storage and compute. Data stays in the storage layer, while compute resources (Virtual Warehouses) process queries. This ensures performance and scalability without interference.
2. Is Snowflake a cloud data warehouse?
Yes, Snowflake is a fully managed cloud-native data warehouse that runs on AWS, Azure, and Google Cloud.
3. Can Snowflake handle both structured and semi-structured data?
Absolutely. Snowflake supports structured data like tables and semi-structured formats such as JSON, Avro, ORC, and Parquet.
Learn SQL from scratch and take control of your data like a pro. Whether you’re analyzing millions of records or just getting started with databases, SQL is the backbone of data analytics, business intelligence, and data engineering. At Tech Town, we simplify SQL with hands-on lessons, real-world projects, and expert guidance tailored for beginners and professionals alike.
🚀 Practical. Powerful. Career-Boosting.
No fluff. Just real skills for real impact.
👉 Ready to become data fluent?
In the age of digital transformation, organizations across industries are overwhelmed with data but struggle to extract real value from it. The ability to not only analyze but also visualize data through interactive dashboards and reports is now essential. Decision-makers require fast, accurate, and actionable insights, and that’s exactly what interactive dashboards can deliver.
This post will walk you through what makes dashboards influential, the tools and techniques you can use, and best practices to ensure your dashboards not only inform but drive real business outcomes.
Keywords: Interactive dashboards, data visualization, business intelligence, decision-making, Power BI, Tableau, real-time analytics, data-driven decisions, KPIs, performance tracking.
Data is only as useful as the decisions it drives. Traditional static reports often leave decision-makers with more questions than answers. In contrast, interactive dashboards allow users to explore data dynamically, view underlying patterns, and get customized answers on the fly.
For example, a sales dashboard that displays KPIs like total revenue, profit margin, and customer acquisition can be enhanced by allowing users to filter data by region, product category, or sales rep—offering more control and insight.
With real-time data integrations and advanced visualization tools like Power BI, Tableau, Looker Studio, or Qlik, users no longer have to rely solely on analysts to generate reports. They can slice and dice data as needed, run comparisons, identify trends, and drill into problem areas—all within seconds.
To ensure your dashboards genuinely influence decisions, they must go beyond simple visuals. Here are the critical elements to include:
Ensure the dashboard focuses on the right Key Performance Indicators (KPIs). These metrics must be aligned with business objectives—whether it’s improving conversion rates, reducing customer churn, or optimizing supply chain efficiency.
Give users control over what they see. Allow filtering by date, geography, product line, or customer segment so users can interact with the data and discover insights relevant to their role.
Let users move from summary to detail. For example, clicking on a high-level sales figure should take them to product-level or store-level performance for root cause analysis.
Make sure your dashboards are accessible on multiple devices—desktop, tablets, and mobile. Executives need insights on the go.
Use live connections to databases or APIs so your dashboard reflects the most up-to-date information, especially for mission-critical processes like inventory tracking, financial monitoring, or digital campaign performance.
Here are some popular business intelligence tools that make it easy to create high-impact dashboards:
Each of these tools supports:
Creating an interactive dashboard is only half the job. Here’s how to make sure it actually drives decision-making:
Before designing visuals, understand the goals of the user. Are they trying to reduce costs? Increase sales? Improve NPS? Your design should help them answer these questions quickly.
Different data needs different visuals:
Don’t try to include everything in one view. Group visuals logically, limit color usage, and maintain consistent formatting to avoid confusion.
Always include:
Share your prototype dashboard with end users and iterate based on their needs. A dashboard that works for a sales manager might not be ideal for a finance controller.
Let’s take a real-world scenario:
Problem: An e-commerce manager wants to identify why revenue dropped in Q2.
Solution:
Impact: The manager reallocates inventory and adjusts marketing campaigns, recovering performance by Q3.
This is how an interactive dashboard transforms raw data into action.
Dashboards are no longer static summaries—they are strategic tools that empower businesses to make data-backed decisions faster and smarter. When designed correctly, they provide clarity, focus, and impact.
Interactive dashboards are no longer just for analysts. With the right tools and best practices, anyone in your organization—from executives to team leads—can gain insights, ask questions, and take confident action.
Start by identifying the right questions, designing with user experience in mind, and continuously improving your dashboards. In doing so, you’ll transform the way your organisation makes decisions.
If you’re looking to design dashboards using Power BI, Tableau, or Looker Studio that’re not only visually compelling but also business-ready, we can assist you. Reach out for a free consultation, or check out our tutorials and templates to get started.
At Tech Town, we believe that education is not a privilege—it is a right. In a world fueled by rapid digital transformation, access to high-quality education is no longer optional. It is the key to empowerment, progress, and a brighter future for all.
We are dedicated to delivering excellence in everything we do. Our mission is simple yet powerful: to make top-tier tech education accessible, engaging, and impactful for learners everywhere, regardless of background, income, or geography.
Whether you’re a student, a working professional, or a curious mind—you deserve the tools, knowledge, and guidance to succeed in today’s technology-driven world.
At Tech Town, we combine quality, innovation, and efficiency to create a unique learning experience:
Our courses, blog posts, and tutorials are curated by experienced industry professionals. We focus on practical skills, real-world use cases, and job-ready learning paths in areas like:
Data Science
Data Analytics
SQL & Python Programming
Power BI & Visualization
Cloud Tools like Snowflake & Microsoft Fabric
We don’t believe in outdated teaching methods. Tech Town uses interactive dashboards, hands-on projects, and AI-driven personalisation to keep learners engaged. We’re constantly evolving with the industry to deliver modern education that keeps you ahead of the curve.
Time is valuable. Our content is structured, concise, and targeted, so you can learn faster and smarter. No fluff—just focused learning that helps you build skills, solve problems, and grow in your career or business.
We understand the challenges many face—limited internet access, financial constraints, or a lack of technical background. That’s why we’re working to offer:
Free learning resources
Affordable courses
Guidance in both Hindi & English
Community support and mentorship
We believe no one should be left behind just because of where they were born or what they can afford.
Education doesn’t just benefit individuals—it uplifts entire communities. At Tech Town, we’re proud to support students, freelancers, small business owners, and working professionals in:
Getting hired in tech and analytics roles
Building freelance careers
Launching tech startups
Upskilling for promotion or career switch
Automating business processes using data
When we say “Everyone Should Get an Education,” we mean it—with action, not just words.
We live in an age where technology is reshaping every industry. But without education, the digital revolution becomes a digital divide. That’s why we’re on a mission to bridge the gap—with content, community, and compassion.
At Tech Town, we don’t just teach tech.
We unlock potential.
We open doors.
We believe in YOU.
Join us on our journey. Explore our tutorials, join our Telegram learning group, or enroll in our next live course. Because when everyone gets an education, everyone grows.
Welcome to TechTown – your trusted destination to learn data analytics, master modern tools, and advance your career with hands-on projects and expert guidance.